
OIL FIELDS FACT SHEET
How is Oil Formed?
Oil is a substance that consists of complex hydrogen and carbon compounds, called hydrocarbons. Oil is found underground and forms over millions of years from fossil remains of prehistoric forests and seafloor life. The plants and animals were buried in layers of silt and sand before they had time to decompose, and a combination of bacteria and pressure from the overlying sediment converted the plants and animals into crude oil. Oil is found in oil-laden tar sands and shale, sedimentary rock deposits and the seafloor. Canada has 40 sedimentary basins, covering 47 percent of the land surface, and although not all sedimentary basins have oil accumulations, Canada’s oil production industry is growing very quickly. The following map shows the locations of the major sedimentary basins in Canada.
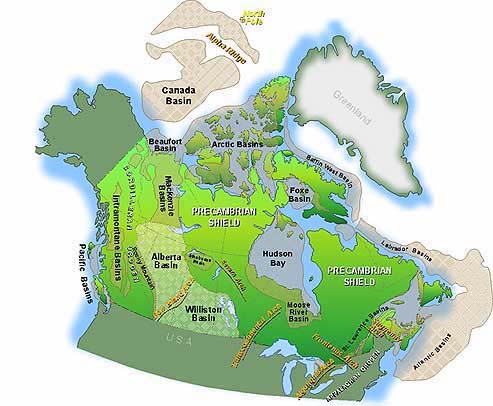
Location of Major Sedimentary Basins Across Canada
One barrel of oil holds 160 litres, and one tonne of oil is between seven and nine barrels of oil, depending on the type of oil. Canada holds the second largest oil reserves in the world, and currently produces more than 2.6 million barrels of oil each day, nearly half of which is heavy oil. Heavy oil is dense and thick, and costs more to produce and refine than light oils. The refinement of heavy oils also uses more natural resources and produces more pollution than light oils do. Much of Canada’s oil industry growth is due to the tar sands, particularly in Alberta. Tar sands consist of sand, clay and bitumen; bitumen is semi-solid or solid petroleum, with a tar-like consistency. Bitumen can be blended into heavy oil or upgraded into synthetic light oil. It is more costly to mine bitumen because it is poor quality oil, but due to oil shortages around the world, the tar sands industry is growing.
To mine bitumen, the trees are cut down, and the soil is strip-mined, exposing the sand and bitumen. A large machine, called a crusher, breaks up the lumps and removes rocks from the sand. The oil sand is then mixed with warm water, which forms a slurry mixture; a pipeline carries the sludge to an extraction plant, where it enters a settling tank. In the settling tank, sand settles to the bottom, and the bitumen rises to the top (because oil floats on water). The bitumen is skimmed off and mixed with a solvent. This mixture is then put into a centrifuge, which is a large machine that spins very quickly to separate the bitumen from water and clay solids. The following diagram illustrates the basic processes of oil mining.
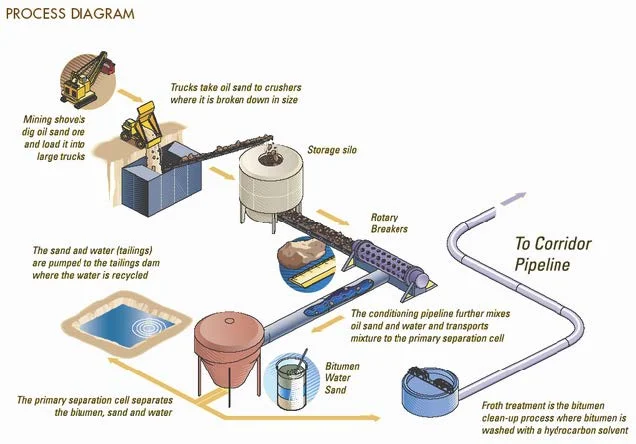
Basic Oil Mining Process
Sometimes, the bitumen is too far underground to be mined; when this is the case, steam is injected underground and the oil is pumped up through wells. To use steam injection, two wells are drilled at different depths and high-pressure steam is injected into the shallower well. Steam enters the oil deposit and softens the bitumen, diluting it and separating it from the sand. The bitumen then collects into the lower well, and is pumped to the surface. The following diagram illustrates the steam injection process.
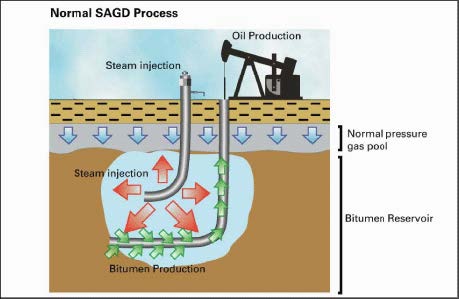
Basic Steam Injection Process
When mining began, and the oil sands industry began growing, it was expected that, by 2020, one million barrels of oil could be produced per day. This goal was met in 2004. That number is expected to triple by 2015, when Canadian oil sands will account for more than 25 percent of North American oil production. By 2020, it is estimated that Canada will produce around five million barrels of oil each day. Oil sands will likely supply the majority of Canada’s oil production; about one-third of oil sands production will require thermal recovery, which is steam injection or similar processes that use great quantities of water. The graph on the left illustrates the actual and predicted growth of Canadian oil production since 1960. The graph on the right shows the actual and predicted growth of the oil sands, in particular, since 1967.

Actual and Projected Oil Production in Canada;
https://en.wikipedia.org/wiki/File:Canadian_Oil_Production_1960_to_2020.png

Actual and Projected Oil Production from Canadian Oil Sands http://www.washingtonpost.com/wp-dyn/content/article/2005/06/14/AR2005061401533.html
What Happens to the Environment During the Mining Process?
The mining of tar sands uses huge amounts of water and natural gas, and is responsible for the majority of Canada’s increased greenhouse gas emissions. According to Greenpeace Canada, tar sands oil production emits five times the amount of greenhouse gas that conventional oil production does! Currently, greenhouse gas emissions from tar sands operations are equal to about 40 million tonnes of carbon dioxide; by 2011, that number is expected to double!
To put that into perspective, the Organisation for Economic Development reports that Canada's carbon dioxide emissions in 2004 were 550.86 million tonnes. According to the Canadian government, about 19 percent, or 104.66 million tonnes, of those emissions were from road transportation. This means that, by 2011, the amount of carbon dioxide that is emitted from tar sands will nearly rival the amount of carbon dioxide that is released by all road transportation in Canada. That is a lot of carbon dioxide coming from a small area of land! In order to meet the Kyoto commitments, Canada must reduce its emissions by about 280 million tonnes per year; as long as the tar sands continue to operate, Canada will be unable to meet the Kyoto requirements.
Mining in the tar sands uses greater quantities of natural resources and is much more environmentally damaging than conventional oil mining. To produce one barrel of oil from the tar sands requires between two and five barrels of water, digs up four tonnes of earth (that is the same weight as 28 to 36 barrels of oil!), and uses enough natural gas to heat a house for one to five days. In 2005, enough dirt and oil sands were moved in two days to fill Yankee Stadium. Very large quantities of natural gas, a relatively clean-burning fuel, are used to convert oil sands to crude oil, which is extremely far from being a clean-burning fuel. According to Greenpeace, it takes between 89 and 178 barrels of natural gas to produce one barrel of crude oil from the tar sands! The following diagram summarizes the major natural resource requirements to produce one barrel of oil.

Currently, mining operations in Alberta are taking enough water from the Athabasca River to sustain a city of two million people (the city of Calgary has a population of just over one million). Of the water that is licensed to be removed from the Athabasca River, about 66 percent is for oil sands mining. According to Greenpeace, the amount of water that is licensed for diversion is 349 million cubic metres of water each year; that is enough water to fill almost 140,000 Olympic swimming pools!
The amount of water that is currently being extracted for mining purposes is too much to sustain the river, especially when one takes into consideration that mining is not the sole user of the Athabasca River water, and that oil production is continuing to increase. If the oil production doubles between 2004 and 2020, as it is expected to, the water requirements will also increase significantly! The oil sands projects that are already planned will increase water withdrawals up to about 529 million cubic metres per year; that is more water than the city of Toronto uses each year!

Athabasca River and Wetlands; David Dodge, The Pembina Institute
Furthermore, the water that is used for mining purposes is not returned to its source. Mining produces hazardous waste, called tailings, which are collected in ponds. Only about ten percent of all water that is used for mining purposes is returned to the source; the other 90 percent ends up in the tailings ponds, which will not be released for many years.
As well, climate change is predicted to impact the water flow in the Athabasca River over the coming decades. Between 1945 and 2005, Fort McMurray has seen a temperature increase of more than two degrees Celsius, according to Schindler and Donahue, and Fort Chipewyan has experienced an increase of more than three degrees Celsius.
The average temperature at Fort Chipewyan is anticipated to rise another 4.8 degrees Celsius over the next several decades. While Fort Chipewyan is projected to receive an increase of 32 millimetres of precipitation, the additional evaporation (due to the increased temperatures and longer summers) will likely be greater than the change in precipitation.
According to Schindler’s research, the lowest winter flows in the Athabasca River during the 1970s were around 150 cubic metres per second. By 2000, this number had decreased to about 100 cubic metres per second, and by 2050, the lowest winter flows are expected to be only 37 cubic metres per second! The First Nations people say that low winter flows over the coming years will make the water excessively contaminated, and many fish species are not likely to survive.
The Athabasca River is the third largest undammed river in North America, and joins the Peace and Birch Rivers to form 6,000 square kilometres of wetland habitat. The Peace-Athabasca Delta contains over 1,000 lakes, hundreds of thousands of birds, 5,000 bison and many other species in a diverse ecosystem. The wetlands also support many First Nations people and communities in the area. In the spring, the lakes often flood, which rejuvenates the wetlands. However, the decreased flow in the Athabasca River is resulting in less frequent floods, and wetlands that are in danger of being lost.
These numerical values mean that the average temperatures are going to rise, which will result in additional evaporation. Fewer glaciers and depleted groundwater resources will also contribute to lower river flows. While the amount of water is decreasing, the demand for it, particularly from expanding oil companies, is increasing. The water that does remain is becoming increasingly polluted and unhealthy.
Mining communities grow, and the surrounding environment changes very quickly. Many communities are situated along the Athabasca River, and are observing the alarming growth of the mining industry and the subsequent environmental damage. Elsie Fabian is an elder in a First Nations community along the Athabasca River, and she has seen the changes occurring:
“The river used to be blue. Now it’s brown. Nobody can fish or drink from it. The air is bad. This has all happened so fast. It’s terrible. We’re surrounded by mines.”
http://www.washingtonpost.com/wp-dyn/content/article/2006/05/30/AR2006053001429.html
For more information about the oil mining operations in Northern Alberta, see the following two articles from the Washington Post: "Canada Pays Environmentally for U.S. Oil Thirst" and "Where Oil is Mined, Not Pumped".
Because of the pollution, many communities that typically relied on hunting, trapping and fishing are finding that they must participate in the mining industry, as it is the only economic option left available to them. The Fort McKay First Nations Council, which includes the Cree and Dene that live in the area, has formed a number of catering, truck driving, and surveying companies.
In addition to the environmental degradation, the health of residents in Northern Alberta is being negatively affected. Residents of Fort Chipewyan, a village of 1,200 on the shores of Lake Athabasca, have experienced very high rates of rare cancers. Leukemia, lymphoma and lupus are being found alarmingly often, and residents believe that the water from the Athabasca River, downstream from oil sands, is to blame.
In 1994, a study by the Center for Economic and Social Rights, based out of New York, found similar trends in a region of Ecuador. Residents had been suffering from skin conditions, as well as increased risks of cancer. Scientists tested the water for polycyclic aromatic hydrocarbons (PAHs), which are a toxic element that is found in oil. They found that the drinking water in the region contained between 33 nanograms of PAHs per litre of water and 2,793 nanograms of PAHs per litre of water. The Canadian guideline for benzo-a-pyrene (BaP), which is one type of PAH, is only 10 nanograms per litre of water. It was found that the high concentration of PAHs was a result of unlined waste pits, or tailings ponds, which allowed the toxic chemicals to leach into water that was used for drinking.
While scientific evidence has not verified that the increased rates of cancer are due to the water, it is a known fact that oil companies are permitted to discharge “process water” into the river. Process water is water that has been used to separate bitumen, and companies are allowed to return untreated or partially treated wastewater into the Athabasca River, as long as the hydrocarbons and chemicals are below Alberta's set limits. However, due to the exponential growth of the oil sands mining industry, there are increasing amounts of hazardous chemicals being added to the river. For example, one of the companies discharges nearly 20 kilograms of oil and grease into the Athabasca River each day (they are allowed to release up to 150 kilograms each day)!
As well, notice in the picture below that the tailings ponds are not far from the Athabasca River. Tailings ponds are containment areas that are filled with mining waste that contains sand, water and several toxic petroleum by-products. These ponds are built like inverted pyramids, using tailings soil to build the walls; companies often try to build tailings ponds as cheaply as possible. According to the Pembina Institute, tailings ponds already cover 50 square kilometres of land in Alberta.
If the high rates of cancer are not due to contaminated water, they are likely due to environmental effects associated with mining operations, as this situation is becoming common in Northern Alberta and Saskatchewan communities.
What happens when the oil is all gone?
Many mining operators believe that technology will be able to find a solution to the extreme environmental damage that mining operations cause. This is a case of counting the chickens before they hatch, because hazardous wastes are piling up and large areas of land are being left bare, with few plants, trees and wildlife, as mining companies move to more oil-rich areas. Mining companies are quick to point out that recent efficiencies mean that less water and natural gas are required to produce each barrel of oil; industry officials say that water is reused up to 17 times. Efficiencies are good, but the increase in oil production requires more water and natural gas than ever before, meaning that these resources are not being conserved.

Athabasca River and Mining Production, Including Tailings Ponds near River; David Dodge, The Pembina Institute
After oil companies move out of an area, they generally claim that they will undertake some reclamation actions; these actions, however, do little to improve a degraded area, where few trees, plants, and wildlife remain. They often fill in pits and plant trees, but the waste ponds from mine tailings take many years to settle and become safe. According to Suncor, one of the large mining companies, they have reclaimed 858 hectares of land since the beginning of their operations. 858 hectares is less than nine percent of the land that they have mined. Another company, Syncrude, claims to have reclaimed 4,055 hectares (or 22 percent) of land that they have mined. However, Alberta Environment reports that, as of 2004, there was no land in the oil sands area that was certified as reclaimed. Only 56.3 square kilometres were under reclamation, while 330.6 square kilometres were currently being disturbed, 950.4 were approved for future disturbance, and 2,000 square kilometres were planned disturbances that had not been approved yet!
If all tar sands projects are approved, 23 percent of Alberta land will end up in a severely degraded state as a result of mining operations. The region of boreal forest and wetlands that is being cleared for oil mining covers 149,000 square kilometres, an area roughly the same size as Florida! While the boreal forest can recover from a certain amount of pollution and degradation, there is a limit to the amount of pollution that the environment can withstand. If tar sands operations continue with current trends, one-quarter of Alberta's land will be left as a wasteland.
Tailings ponds can fail in several ways, including slope instability, seepage, collapse, erosion, overflows due to precipitation and earthquakes. The tailings pond of a Canadian-based mining company, Boliden Limited, collapsed in Spain in April 1998, spilling approximately 32.6 billion litres of toxic sludge into a 32 kilometre section of the Guardiamar River. In addition to contaminating the river water, the tailings pond collapse contaminated an aquifer that was the water source for a wildlife reserve and ruined 60 square kilometres of farmland. The collapse cost the company approximately $10 million in clean-up and restoration costs, but it was estimated that the cost to the farming, fishing and tourist industries would be more than $200 million over the next two years. The long-term farming productivity loss was estimated at $113 million. The picture below shows the aerial perspective of the pond and the lost tailings.

Lost Tailings from Oil Spill in Spain in 1998;
http://www.tailings.info/casestudies/losfrailes.htm
An increase in sulphur and nitrogen oxides from mining operations in Alberta could result in acid rain in the prairie regions. Currently, acid rain is predominantly a problem in eastern Canada, but the increased emissions over the next 20 years put streams and lakes in northern Saskatchewan at risk for acid rain pollution.
The Safe Drinking Water Foundation has educational programs that can supplement the information found in this fact sheet. Operation Water Drop looks at the chemical contaminants that are found in water; it is designed for a science class. Operation Water Flow looks at how water is used, where it comes from, and how much it costs; it has lessons that are designed for Social Studies, Math, Biology, Chemistry, and Science classes. Operation Water Spirit presents a First Nations perspective of water and the surrounding issues; it is designed for Native Studies or Social Studies classes. Operation Water Health looks at common health issues surrounding drinking water in Canada and around the world and is designed for a Health, Science and Social Studies collaboration. Operation Water Pollution focuses on how water pollution occurs and how it is cleaned up and has been designed for a Science and Social Studies collaboration. To access more information on these and other educational activities, as well as additional fact sheets, visit the Safe Drinking Water Foundation website at www.safewater.org.
Did you know that our Operation Water Pollution program teaches students about what water pollution is, what causes it, how it is cleaned up, and what they can do about the problem? Please help us to send more Operation Water Pollution kits (which are guaranteed to be reusable for at least two years) to schools! Please chip in $5 or donate $20 or more and receive an Official Donation Receipt for Income Tax Purposes - or donate $170 to provide an Operation Water Pollution kit for a school.
Resources:
Blum, Justin. June 2005. Where Oil is Mined, Not Pumped.
http://www.washingtonpost.com/wp-dyn/content/article/2005/06/14/AR2005061401533.html
Brooke, James. March 1994. Pollution Of Water Tied to Oil In Ecuador.
http://www.nytimes.com/1994/03/22/science/pollution-of-water-tied-to-oil-in-ecuador.html
Government of Canada. May 2011. Canada's Emissions Trends.
http://www.ec.gc.ca/doc/publications/cc/COM1374/ec-com1374-en-s3.htm
Country statistical profiles: Key tables from OECD.
http://www.oecd-ilibrary.org/economics/country-statistical-profiles-key-tables-from-oecd_20752288
Schindler, D. W.; Donahue, W. F.; & Thompson, John P. May 2007. Running out of Steam? Oil
Sands Development and Water Use in the Athabasca River - Watershed: Science and Market-based Solutions; Section 1: Future Water Flows and Human Withdrawals in the Athabasca River.
https://sites.ualberta.ca/~ersc/water.pdf
Struck, Doug. May 2006. Canada Pays Environmentally for U.S. Oil Thirst.
http://www.washingtonpost.com/wp-dyn/content/article/2006/05/30/AR2006053001429.html
The Pembina Institute. March 2006. Down to the Last Drop: The Athabasca River and Oil Sands.
http://www.pembina.org/reports/LastDrop_Mar1606c.pdf
The Pembina Institute. 2006. Oil Sands Fever Fact Sheet: The Environmental Implications of Canada's Oil Sands Rush: The untold story.
http://www.pembina.org/reports/OSF_Fact72.pdf
The Pembina Institute. May 2006. Troubled Waters, Troubling Trends: Summary Report.
http://www.pembina.org/reports/TroubledW7_Summary.pdf