Subject: Biology
Topic: Bacteria, viruses, and the differences between them. The role that water plays in spreading bacteria and viruses, and the role bacteria and viruses play in contaminating water.
Time Frame: This lesson can be done in two hours (including all of the activities), or it can be extended to allow time for an optional major assignment.
Objectives: The students will be able to distinguish between bacteria and viruses. They will gain an understanding of how quickly viruses replicate. The students will dispel some of their misconceptions about bacteria. The students will perform a lab to further their knowledge about pathogen transmission.
Methodology: Lecture, Simulation, Inquiry, Lab
Materials:
- Distilled water
- 10% ascorbic acid (can be prepared by dissolving 10g of ascorbic acid in 50mL of water, and diluting it to 100mL with water)
- Dropper bottles
- Indophenol indicator solution
- Large test tubes
Space Requirements: The lab activity should be done in the science room or lab. The students should have access to the library and/or computer lab if they are completing the major assignment.
Background Information:
Water’s Role: Under the proper conditions, drinking water can be a link between hosts. A person who is infected excretes millions of pathogenic microbes every day. Some of these microbes eventually find their way into drinking water sources. If other people consume the water while the microbes are still alive and able to reproduce, they have a chance of becoming infected as well. If each new case of infection produces 10 more cases, the problem grows exponentially, creating an epidemic! The route from the end of one digestive tract to another, (i.e. The fecal-oral route) can be stopped with the help of adequate sanitation. Water can be sanitized by treating sewage and wastewater for human waste (for more information on water treatment and sanitation, please see the Fact Sheets available from our homepage at www.safewater.org). Not everyone who drinks contaminated water gets sick from the pathogens. Our immune system does a wonderful job of noticing and killing many foreign invaders to our bodies. The most important thing to remember is that the higher the concentration of pathogens in the water, the higher the chances are that people will become sick.
Disease/Bacteria/Viruses:
Disease: Disease is described as any change (besides an injury) that disrupts the normal function of the body. There are three types of diseases: inherited, environmentally caused, and infectious. Bacteria and viruses, as well as protists and fungi are responsible for causing infectious diseases. Disease causing agents are called pathogens, and the human body provides an extremely suitable environment for the growth of many microscopic organisms (i.e.: right temperature, moist environment, and abundance of nutrients).
Bacteria: Bacteria are single prokaryotic cells which can cause disease in one of two ways.
- They can damage the tissue of the infected organism by breaking down cells for food.
- They can release harmful toxins or poisons into the body. Some examples are as follows:
a. Tuberculosis bacteria break down lung tissue.
b. Bacterial toxins cause many cases of food poisoning.
c. Streptococcus bacteria that cause strep throat release toxins into the blood stream.
Viruses: Viruses can only reproduce by infecting living cells. A typical virus is made up of a core of either DNA or RNA, and surrounded by a protein coat. The outer protein coat is called a capsid, and its function is to allow the virus to enter a host cell. Once the viral cell gets inside of the host cell, the viral genes take over by transcribing the viral genes, and putting the genetic program of the virus into effect. The genetic program can cause the cell to make copies of he virus, and it often destroys the host cell. The viruses that cause the common cold, AIDS, influenza, and measles attack and destroy certain cells, thereby causing the symptoms of the disease. Oncogenic viruses cause cancer by disrupting the normal controls over cell growth and division. Retroviruses contain RNA as its genetic information. After infecting a cell, they produce a DNA copy of the RNA. This DNA is then inserted into the DNA of the host cell. An example of a retrovirus is HIV.
Directions/Procedure:
- Start the lesson by asking the students if they have ever been sick. Ask them if they went to the doctor. What did the doctor tell them was wrong with them? Ask them what they think caused their illness? The answers will vary, but bacteria and/or viruses should come up in the discussion. Tell the students that bacteria are very different from viruses, and that this lesson will show them the differences, as well as how they spread.
- Give the students a short lecture describing the physical characteristics of bacteria and viruses. Showing pictures of each is helpful. Give the students some examples of each.
- You can dispel the misconception that all bacteria are bad by explaining that bacteria are nature’s recyclers, and that only a small percentage of all bacteria are actually bad for us. Scientists use bacteria to make useful materials, and also to degrade wastes. Some of the products of inserting genes into bacterial cells are plastics, pharmaceuticals, pesticides, and foods. Bacteria are also used in mining metals and in cleaning up industrial wastes.
- You can gather newspaper and magazine articles about specific bacterial and viral infections (or have the students do this in advance). Make a list on the board of the diseases that are presented in each article, and have the students decide which are viral and which are bacterial. Have the students discuss how the pathogen is contracted, as well as which people are most commonly affected by it and how they might go about treating it. Some examples are:
a. Viral: Chickenpox, Influenza, Mumps, Smallpox, Hepatitis A and B, AIDS, the common cold, and Rabies
b. Bacterial: Cholera, tooth cavities, Dysentery, Lyme Disease, and Typhoid Fever
- Ask the students about some possible ways of avoiding bacterial and viral infections. Their answers should include the following: sanitations, good hygiene, lifestyle changes, vaccinations, healthy immune systems, and proper storage and preparation of food.
- Explain that viruses replicate very quickly. Tell the students that a single virus that infects a bacterial cell can produce 100 new viruses in 20 minutes. Have students calculate how many viruses would be present one hour after a single virus infected a single bacterium in a culture. The answer is 1 million!
- Have the students start the lab (included at the end of the lesson plan). Allow at least 40 minutes for this activity, including cleanup. It might be a good idea to do the lab on the second day to ensure that there is enough time for completion. The data tables and teacher notes are provided after the student version of the lab handout.
Evaluation:
- This lesson can be evaluated in many ways. The lab can be handed in a graded as part of the lab component for the class.
- You could ask the class to design a virus, where they create a fictitious virus. They should produce a model or drawing of their virus, as well as historical information about the origin, components, the host it affects, the transmission of the virus, and the affects it has on the host. You could have the students share their creations with the class.
- Another idea is to give the students a major assignment on this topic. You could have the students choose 2 diseases, one caused by a bacterium and one caused by a virus. Students can use textbooks, do outside research, or create fictitious diseases. Ask students to draw plausible structures for the pathogens and to describe the method of infection, prevention, and of treatment. Students’ drawings must depict the characteristics of bacteria and viruses that were described and shown in the lecture.
- Look at Canada’s list of waterborne diseases. Are they bacterial or viral? Look at the list of waterborne diseases tracked in the United States, Europe, and/or other developing countries. Why do you think Canada tracks so few waterborne diseases?
Reference:
Biology: Principles and Explorations. Holt, Rinehart, and Winston. Copyright 2001
Lab: “Who got us all sick?”
Communicable diseases are caused by pathogens and can be transmitted from one person to another. You can become infected by a pathogen in several ways, including by drinking contaminated water, eating contaminated foods, receiving contaminated blood, and inhaling infectious aerosols (which are droplets from coughs or sneezes). In this lab you will simulate the transmission of a communicable disease.
Objectives:
- Simulate the transmission of a disease
- Determine the original carrier of the disease
Based on these objectives, write a question you would like to explore about disease transmission.
Procedure Part A: Simulate Disease transmission
- You will be given a dropper bottle of an unknown solution. When your teacher says to begin, transfer 3 dropperfuls of your solution to a clean test tube.
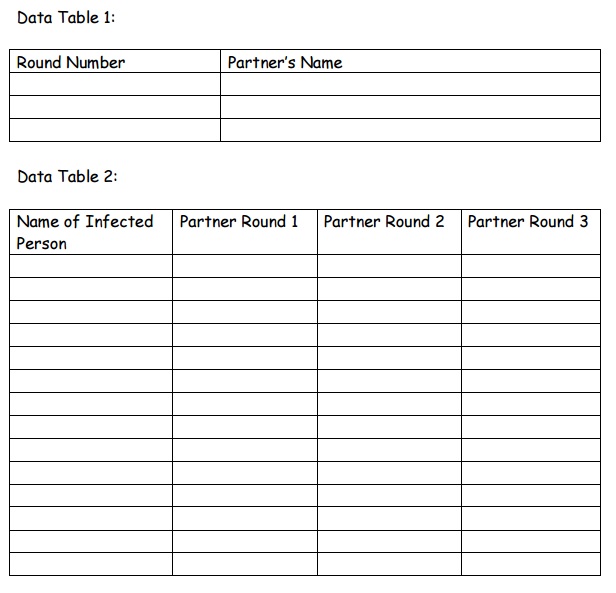
- Choose a partner for Round 1 and write the name of your partner in Data Table 1.
- Pour the contents of one of your test tubes into the other test tube. Then pour half of the solution back into the first test tube. You and your partner now share any pathogens either of you might have.
- Select a new partner for Round 2 and write the name of your partner in Data Table 1. Repeat Step #3.
- Select a new partner for Round 3 and write the name of your partner in Data Table 1. Repeat Step #3.
- Add one dropperful of indophenol indicator to your test tube. “Infected” solutions will stay colorless or turn light pink. “Uninfected” solutions will turn blue. Record the results of your test.
Procedure Part B: Trace the Disease Source
- If you are infected, write your name and the name of your partner in each round on the board. Mark your infected partners. Record all of your class’s data in Data Table 2.
- To trace the source of the infection, cross out the names of the uninfected partners in Round 1. There should be only 2 names left. One is the name of the original disease carrier. To find out who got everyone else sick, place a sample from his or her dropper bottle in a clean test tube, and test it with indophenol indicator.
- To show the disease transmission route, make a diagram similar to Chart 1. Show the original disease carrier and the people each disease carrier infected.
Analysis and Conclusions:
- After Round 3, how many people were “infected”? Express this number as a percentage of your class.
- What do you think the clear fluids each student started with represent? Explain why.
- Can someone who does not show any symptoms of a disease transmit the disease? Explain.
- Write a new question about disease transmission that could be explored with further investigation.
“Who got us all sick?” Teacher’s Notes
Preparation: Use stock bottles of distilled water for half of the students and dropper bottles containing 10% ascorbic acid for the rest of the students. Both solutions will be clear. If the procedure is followed precisely, the route of transmission can be traced easily.
Answers to the introductory question will vary. An example of a question is: Can you determine whether a disease has been caused by the passing of pathogens from person to person or by environmental conditions?
Procedure: At the beginning of the lab, one half of the students will have the acidic solution. After they share their solutions, most students will have acidic mixtures (“infected” + “infected” or “infected” + “non-infected”). A few students will have non-acidic (“non-infected” + “non-infected”) solutions. Each repetition of the infection activity will increase the number of “infected” individuals. After the addition of the indicator, most solutions will remain colorless or turn pink. If the procedure has been followed precisely, the route of transmission can be traced easily. You could construct a diagram of the route of infection on the board for the class to see. A diagram could look like this:
Answers to the Analysis and Conclusion Questions:
- Answers will vary depending on class size.
- The clear fluids represent pathogen-containing water.
- Yes.
- Answers will vary. For example: Would dividing the class into two or three quarantined groups before repeating the experiment affect disease transmission rate?