
COST-BENEFIT ANALYSIS: TREAT THE ILLNESS OR TREAT THE WATER? FACT SHEET
It isn’t cheap to treat water so that it is safe to drink. But it also isn’t cheap to treat everyone who becomes ill during a waterborne illness outbreak. This diagram shows the relationship between the risk of contamination and level of water protection. As the level of protection becomes more effective, the cost of water treatment generally rises, as well. Unfortunately, government agencies generally attempt to minimize costs while the health effects have not been properly assessed.
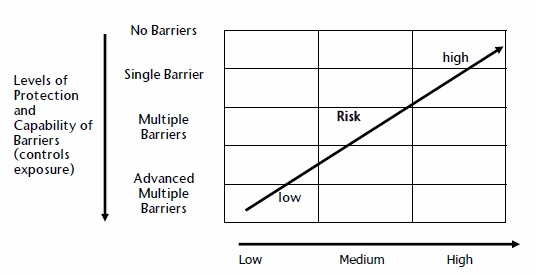
Hazard or Level of Challenge
Level of Barrier Required for Level of Risk
However, this approach results in some serious problems. In developing countries, waterborne disease epidemics are common. Many people like to think that developed countries are safe from contaminated water. But, in 1993, the United States Environmental Protection Agency estimated that about 403,000 people became ill, and more than 100 people died, when Cryptosporidium contaminated the water supply in Milwaukee, Wisconsin. In 2000, E. coli contaminated the water supply in Walkerton, Ontario, causing seven deaths and over 2000 illnesses. In North Battleford, Saskatchewan, in 2001, Cryptosporidium contaminated the water and was responsible for between 5800 and 7100 illnesses.

Walkerton, Ontario Water Tower
http://www.wsws.org/en/articles/2000/06/walk-j10.html
When a community experiences a waterborne illness outbreak, we hear about it. But there are a significant number of illnesses that we do not hear about. Health Canada only tracks a select few diseases that are commonly waterborne. Furthermore, the actual number of cases of waterborne illnesses is usually about ten times higher than the reported number.
The Centers for Disease Control and Prevention estimates that there are between four and 33 million cases of gastrointestinal illness associated with public drinking water systems in the United States each year. This number does not include the number of illnesses due to private water sources, recreational water sources, or illnesses other than diarrhea. When there are outbreaks of E. coli, Cryptosporidium, or other waterborne pathogens, the recovery and repair costs are substantial. This begs the question: is it better to treat the water to ensure that it is safe for human consumption, or is it alright to provide minimal water treatment and hope for the best?
Who is Responsible for Making Sure Our Drinking Water is Safe?
The legislation and standards of drinking water vary from country to country. In Canada, the federal government sets guidelines for drinking water, and each provincial and territorial government is responsible for drinking water provisions within their province or territory. Due to funding, facilities and water that may be difficult to treat, each province and territory can decide which guidelines they will follow and which they will not.
The exception to provincial and territorial responsibility for water is in the case of national parks, military bases and First Nations communities, where the federal government is responsible for drinking water. For First Nations communities south of 60 degrees parallel, responsibility for drinking water is shared between the First Nations community and the federal government. Indian and Northern Affairs Canada (INAC) provides funding, and Health Canada provides water quality monitoring assistance for the distribution system. The federal government also needs to monitor the raw water so that it can tell which water treatment plants work. In the territories (north of 60 degrees parallel), the territorial governments and INAC are responsible for safe drinking water provisions in both First Nations and non-First Nations communities.
How are Water Treatment Facilities Funded?
Water treatment and distribution systems are generally funded by local municipalities and cities, sometimes supplemented by meagre amounts from the federal and provincial governments. According to the Federation of Canadian Municipalities, 92 cents of every tax dollar goes to the federal and provincial governments, which leaves cities with only 8 cents from each tax dollar to use to fund a number of services. And, it has been estimated that the public water infrastructure in Canada has a deficit of over $50 billion.
First Nations communities receive funding from INAC and the local community. For example, according to INAC, in June 2007, a new water treatment plant opened in Mashteuiatsh, an Innu community in Quebec. For this project, INAC provided $4.2 million, and the community invested an additional $1.2 million. But many First Nations communities have water facilities that are comparable to conditions in developing countries. Health Canada generally invests around $5 million each year to protect and enhance drinking water quality on reserves. In the 2003 federal budget, the government committed itself to investing $600 million over five years to support the First Nations Water Management Strategy.
To put that into perspective, consider this: According to the city of Winnipeg, it will cost about $214 million, plus $12.75 million per year to design, engineer, construct, and maintain a UV disinfection system. The amount of money that the federal government allocates to protecting and enhancing drinking water on reserves is not nearly enough to repair the situation that many drinking water facilities are in.
Who is Responsible for Providing Healthcare in Canada? How is Healthcare Funded?
Each province and territory is responsible for providing healthcare services in their province or
territory. The Canadian healthcare system is funded by the federal and provincial governments.
Ultimately, healthcare is funded from personal and corporate income tax. Some provinces, such as Alberta, British Columbia, and Ontario, also charge supplemental health premiums. The federal government contributes a sum of money to the provinces for healthcare, investing over $30 billion in some years. Healthcare expenditures, however, total more than $100 billion each year, which works out to more than $3000 per capita. In 2003, of the countries that are members of the Organisation for Economic Cooperation and Development (OECD), the United States spent the most on healthcare (at $5635 per capita), followed by Norway (at $3807 per capita), Switzerland (at $3781 per capita) and Canada (at $3001 per capita). The lowest expenditures occurred in Mexico (at $583 per capita) and Turkey (at $513 per capita). Compare that with the healthcare expenditures in developing countries, which tend to be less than one-tenth the amount that most European countries, as well as Canada and the United States, pay per capita per year. For example, in 1994, Costa Rica spent the most on healthcare, out of any developing country, and that was only $140 per capita per year!
By 2005, in Canada, average expenditures had risen to approximately $4400 per capita. The lowest healthcare expenditures in Canada occur in Quebec, where the average is $3900 per capita. The highest healthcare expenditures occur in the Yukon, the Northwest Territories, and Nunavut, where the averages range from $6000 to $10,700 per capita.
When the World Health Organization (WHO) conducted a cost-benefit analysis of improving water and sanitation services at an international level, they estimated the healthcare cost associated with a diarrheal illness to be between $10 and $23, depending on the geographic region. Healthcare costs are higher in remote areas, which means that, in providing safe drinking water in isolated regions, healthcare costs can be reduced by a significant amount.
Using the low estimate of $10 per diarrheal illness, the United States could avoid between four and 33 million dollars in healthcare costs for diarrheal illnesses each year if drinking water were effectively treated! Though there are fewer people in Canada, Canada could probably save millions of dollars in healthcare costs as well. And these cost savings only include healthcare costs associated with diarrheal illnesses; when productive days that are lost to illness are considered, the saved expenses could be many times higher.
What Kinds of Costs are Associated with Waterborne Disease Outbreaks?
There are many direct and indirect costs associated with waterborne illnesses. A great number of illnesses and associated costs can be avoided with effective water treatment. The WHO divides the benefits (or avoided or minimized costs) into the following three categories:
1. Direct economic benefits of avoiding waterborne illnesses. This simply refers to the amount of money that is saved from healthcare expenses.
2. Indirect economic benefits, which include a decrease in workdays lost to illness and a longer lifespan, because these benefits enable people to work more.
3. Non-health benefits include a decrease in time spent collecting water (especially for people who have long distances to walk to get water), an increase in property prices around water sources, and increased time spent in leisure activities.
The Safe Drinking Water Act, in the United States, categorizes water benefits into the following seven categories:
1. Avoided illnesses, which are then classified into decreased mortality (or fewer premature deaths) and decreased morbidity (or fewer people who experience a reduction in their physical or mental well-being from a disease).
2. Enhanced aesthetic qualities, where aesthetic qualities refer to the taste, odour and colour of the water. People often base their confidence in the safety of the water on aesthetic factors, so when the taste, odour and colour of the water improve, consumer satisfaction also improves.
3. Avoided cost of averting behaviour, where averting behaviour refers to the use of water treatments, such as filters and reverse osmosis units, on tap water. Effective treatment removes the need for water treatment in the home, and also reduces human exposure to the contaminants that may be in their water.
4. Avoided material damage, such as corrosion and breakage of pipes. Minimizing the damage to materials also reduces the amount of water lost due to leakage.
5. Avoided cost of market production, which means that when restaurants, food processors and manufacturing industries do not have to treat water before using it, they pass on these savings to the consumers.
6. Nonuse benefits, such as personal satisfaction from the knowledge that others have access to safe drinking water or that natural resources are being protected.
7. Information benefits, meaning that when people have access to public information about their water, they can make informed decisions and avoid threats to their health.
What kinds of costs are associated with effective water treatment facilities?
The costs of treating water vary, depending on the quality of the raw water, the type of treatment, and the quality of existing facilities. In 1998, the Canadian Water and Wastewater Association estimated that $27.5 billion would have to be invested in water treatment and distribution systems over the following 15 years.
The study that was published by the WHO in 2004 uses the following five intervention levels to determine the costs and benefits of implementing safe drinking water and sanitation services:
1. Halve the proportion of people who do not have access to improved water sources by 2015.
2. Halve the proportion of people who do not have access to improved water sources and improved sanitation.
3. Provide access to improved water and improved sanitation for all.
4. In addition to improving water and sanitation for all, provide a minimum of water disinfection at the point of use.
5. Provide access to a regulated piped water supply and sewage connection into houses for all.
The following table shows the Unit Cost Data for the Annual Capital Cost and the Annual Recurrent Cost in US$, as of 2010, for several countries (split by rural and urban), by type of water supply or sanitation improvement.


Source: https://apps.who.int/iris/bitstream/handle/10665/75140/WHO_HSE_WSH_12.01_eng.pdf
You can see that the costs of installing safe drinking water measures are relatively small, especially when compared with the long list of benefits of safe drinking water.
So which is More Cost-effective: Treating the Illnesses as they occur or treating the Water so that it is Safe?
The most noticeable and measurable benefit of effectively treated water for drinking is the reduction of waterborne illnesses. The following chart shows the estimated benefits for health economic benefits for the example of diarrheal diseases.
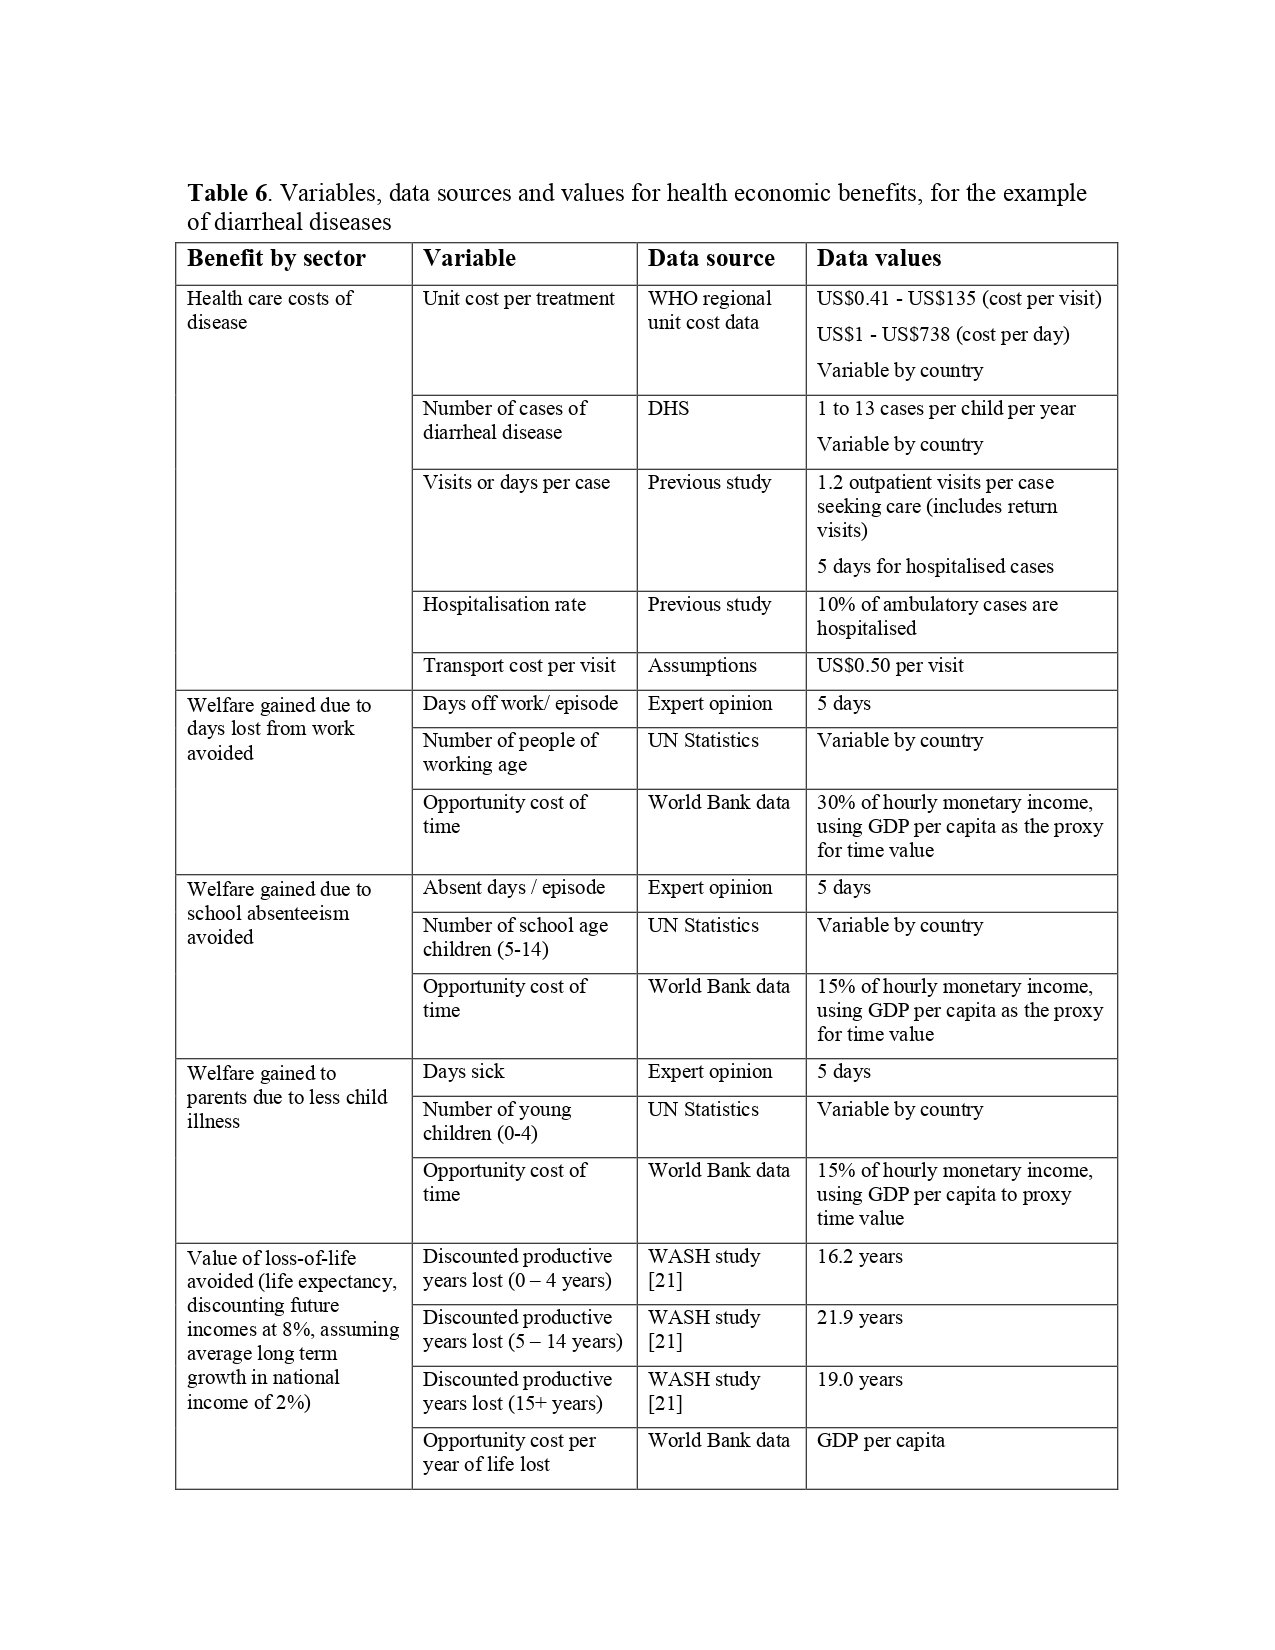
Source: https://apps.who.int/iris/bitstream/handle/10665/75140/WHO_HSE_WSH_12.01_eng.pdf
You can see that, if everyone in the world had access to the water and sanitation services that most of us in Canada enjoy, the benefits would be enormous!
The following table shows that there would be enormous time savings, which would increase hourly GDP per capita:
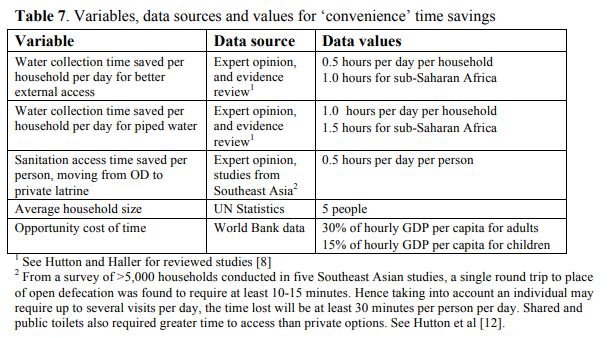
Source: https://apps.who.int/iris/bitstream/handle/10665/75140/WHO_HSE_WSH_12.01_eng.pdf
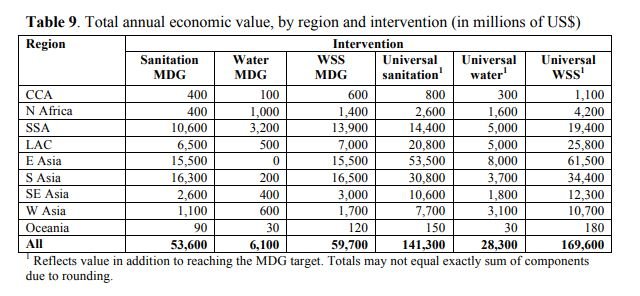
The next table shows the total annual economic value, by region and intervention, in millions of US$. Over $169 billion US could be added in economic value!
Source: https://apps.who.int/iris/bitstream/handle/10665/75140/WHO_HSE_WSH_12.01_eng.pdf
The following table shows that there could be $15 billion in US health care gains.

Source: https://apps.who.int/iris/bitstream/handle/10665/75140/WHO_HSE_WSH_12.01_eng.pdf
The following table shows that there would be over $12 billion in the US gained in terms of the annual value of mortality reductions.

Source: https://apps.who.int/iris/bitstream/handle/10665/75140/WHO_HSE_WSH_12.01_eng.pdf
So, the cost benefit analysis that the World Health Organization undertook tells us that, globally, approximately $169 billion US could be saved if drinking water and sanitation services were improved. This total does not even take into consideration the human right to water, and the immeasurable emotional and psychological cost of losing a friend or family member to a waterborne illness!
The following two graphs show that there is an average benefit-cost ratio of 5.5 of interventions to attain universal access to improved sanitation (in some regions, the benefit-cost ratio is as high as 8.0!) and that there is an average benefit-cost ratio of 2.0 of interventions to attain universal access to improved drinking water sources.


Source: https://apps.who.int/iris/bitstream/handle/10665/75140/WHO_HSE_WSH_12.01_eng.pdf
What About Here in Canada?
Let’s turn from an international focus to a national focus. In May and June of 2000, the water supply in Walkerton, Ontario, became contaminated with the E. coli bacteria. In the end, there were seven deaths and more than 2000 people became ill. Households and businesses could not use their water for eight months, as every component of the water supply system, right up to the kitchen taps, had to be disinfected. The following table summarizes the calculated economic cost estimates of the water crisis.

Estimated Costs Associated with E. coli Outbreak in Walkerton, Ontario;http://www.archives.gov.on.ca/en/e_records/walkerton/part2info/commissuepapers/13livernois/14-Livernois1.pdf
The average cost per household was reported to be $3764. Within the household costs were
costs for treatment, water pickup, food replacement and travel costs. The total costs for healthcare were in the range of $6.6 million. The cost to repair the water treatment plant was almost $10 million.
After the Walkerton crisis, a study was done to find an alternative long-term water source. There were two options, one costing approximately two million dollars and the other costing about six million dollars. To account for leasing the present water filtration system while the new one is constructed, it is estimated that the two million dollar option would cost a minimum of three million dollars, and could well exceed ten million dollars. But compare the ten million dollars for the water treatment system with the $64.5 million that the Walkerton crisis ended up costing! And, that doesn’t even take into consideration the value of lives lost and illnesses suffered. The author of the study, attempting to put a statistical value on a human life, estimated these costs at $90.8 million, bringing the total cost of Walkerton to $155 million!
In the Cryptosporidium outbreak in North Battleford, the costs were slightly lower, as no one died as a result. However, a group of 700 people who became ill received $3.2 million for compensation. The estimated costs for legal fees and the public inquiry were approximately $400,000. After the outbreak, the city committed itself to building a new sewage treatment plant for $15 million. Even with minimal data, it is easy to see the costs that the city of North Battleford could have saved by ensuring that the water treatment facility could produce safe drinking water. For more information about waterborne disease outbreaks (in particular, those that occurred in Walkerton, Ontario; North Battleford, Saskatchewan; New Orleans, Louisiana and Milwaukee, Wisconsin), see the lesson plan in Operation Water Health called “Cases of Contamination”.
Though these outbreaks may be caused by different contaminants, in different areas of the world and in various levels of severity, they all have one thing in common: waterborne disease outbreaks are avoidable, and the benefits of providing safe drinking water always outweigh the costs of building the infrastructure to ensure effective water treatment.
The Safe Drinking Water Foundation has educational programs that can supplement the information found in this fact sheet. Operation Water Drop looks at the chemical contaminants that are found in water; it is designed for a science class. Operation Water Flow looks at how water is used, where it comes from and how much it costs; it has lessons that are designed for Social Studies, Math, Biology, Chemistry and Science classes. Operation Water Spirit presents a First Nations perspective of water and the surrounding issues; it is designed for Native Studies or Social Studies classes. Operation Water Health looks at common health issues surrounding drinking water in Canada and around the world and is designed for a Health, Science and Social Studies collaboration. Operation Water Pollution focuses on how water pollution occurs and how it is cleaned up and has been designed for a Science and Social Studies collaboration. To access more information on these and other educational activities, as well as additional fact sheets, visit the Safe Drinking Water Foundation website at www.safewater.org.
Did you know that our Operation Water Health program provides teachers with the information they need to teach their students about what healthy drinking water is, what unhealthy drinking water is, and health problems that can be caused by drinking unhealthy drinking water? Please help us to keep our Operation Water Health program updated! Please chip in $5 or donate $20 or more and receive an Official Donation Receipt for Income Tax Purposes.
Resources:
Brubaker, Elizabeth. 2002. Lessons from Walkerton.
https://environment.probeinternational.org/2001/11/27/lessons-learned-walkerton/
Canadian Broadcasting Corporation. 2003. $3.2 million for North Battleford water victims.
http://www.cbc.ca/news/canada/3-2-million-for-north-battleford-water-victims-1.411799.
Canadian Health Care. 2007. Health Care Funding. http://www.canadian-healthcare.org/page8.html
Corso, Phaedra S., Kramer, Michael H., Blair, Kathleen A., Addiss, David G., Davis, Jeffrey P., & Haddix, Anne C. 2003. Cost of Illness in the 1993 Waterborne Cryptosporidium Outbreak, Milwaukee, Wisconsin. https://wwwnc.cdc.gov/eid/
Government of Canada. 2017. Notifiable Diseases Online. http://diseases.canada.ca/notifiable/
Health Canada. 2015. Drinking water quality in Canada. https://www.canada.ca/en/health-canada/services/environmental-workplace-health/water-quality/drinking-water.html
Hutton, Guy. 2012. Global costs and benefits of drinking-water supply and sanitation interventions to reach the MDG target and universal coverage.
https://apps.who.int/iris/bitstream/handle/10665/75140/WHO_HSE_WSH_12.01_eng.pdf
Insurance Canada. 2005. Health care spending to reach $142 billion this year.
https://www.insurance-canada.ca/2005/12/07/health-care-spending-to-reach-142-billion-this-year/
Livernois, John. 2002. The Walkerton Inquiry Commissioned Paper 14: The Economic Costs of the Walkerton Water Crisis. http://www.archives.gov.on.ca/en/e_records/walkerton/part2info/commissuepapers/13livernois/14-Livernois1.pdf
Livernois, John. 2001. The Walkerton Inquiry Commissioned Paper 15: Value-of-Life Estimates in an Economic Cost Assessment. http://www.archives.gov.on.ca/en/e_records/walkerton/part2info/commissuepapers/13livernois/15-Livernois2.pdf
Morbidity and Mortality Weekly Report. March 2007. Notice to Readers: World Water Day -- March 22, 2007. http://www.cdc.gov/mmwr/preview/mmwrhtml/mm5610a7.htm.
Saskatchewan Government. 2012. 2011-2012 Annual Report: Ministry of Environment - State of Drinking Water Quality in Saskatchewan.
https://www.wsask.ca/wp-content/uploads/2021/03/2011-12-Safe-Drinking-Water-Annual-Report.pdf
Standing Policy Committee on Public Works. 2002. Re: Water Treatment for the City’s Water Supply - Phase III.
http://www.winnipeg.ca/waterandwaste/pdfs/water/water_treatment_revised_report.pdf