
THE EFFECT OF CLIMATE CHANGE ON WATERBORNE DISEASES FACT SHEET
What Impact will Climate Change Have on Water?
Climate change is expected to increase the severity of weather. This means that some regions will experience an increase in rainfall and flood risk, while regions that are prone to droughts may experience more extreme droughts. The following map illustrates the predicted annual precipitation changes that are expected in the year 2050.

Expected Precipitation Change from 1961-90 to 2040-60
As well, the average temperature is expected to increase; certain areas will experience more of a temperature increase than others. In the regions of warmer surface temperatures, the speed of the hydrological cycle would increase, resulting in faster evaporation and more precipitation. The following map shows the predicted temperature changes that are expected for Canada in 2050.
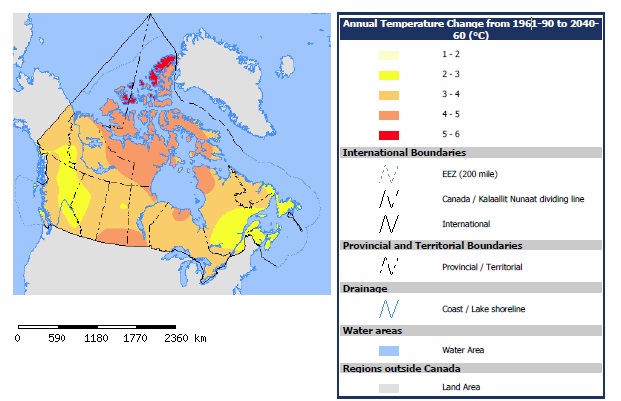
Expected Temperature Change from 1961-90 to 2040-60
But How Does Increased Precipitation Affect Water Quality?
Increased precipitation will increase the risk of flooding in many areas of the world. Floods can increase human exposure to pathogens, as contaminants are spread by floodwaters. Developing countries are particularly susceptible to this, as water carries wastes, shallow water provides breeding conditions for mosquitoes, and drainage and sewage systems can become backed up. Water treatment facilities can become damaged, which can result in the distribution of untreated or improperly treated water. Sewer and water pipes can break, which can cause drinking water to become contaminated with sewage. Floods can also transport fecal matter from the ground or sewers that have overflowed, and contaminate wells, boreholes and surface waters.
There are three main categories of diseases that result from floods. The first category includes waterborne diseases, the most common being a variety of diarrheal illnesses. The second grouping includes mosquito-borne diseases, as low-lying water provide adequate breeding conditions. The final category is infections caused by exposure to water, and include fungal skin diseases, eye infections and respiratory illnesses.
As well, flooding increases the amount of runoff from fields. This can add great quantities of sediment and nutrients to the water. Excess nutrients cause algae blooms, which can disrupt the aquatic life and greatly impair the quality of the water. An American study recently found that, of 548 disease outbreaks in the United States between 1948 and 1994, over half were preceded by a period of heavy rainfall. Outbreaks from surface water contamination generally occurred in the same month as the extreme precipitation; whereas outbreaks associated with groundwater contamination generally occurred about two months after the extreme precipitation.
The outbreak of E. coli in Walkerton, Ontario, is a good example of how excessive precipitation can increase the probability of water contamination. On May 8, 2000, a heavy rainfall began in Walkerton. On each of the first four days, the community received 10 to 20 millimetres of rainfall. On May 12, 70 millimetres of rain fell. This amount of rainfall was unusual, and could be expected once every 60 years. It is believed that the heavy rain overburdened the groundwater aquifers, and, through runoff, animal wastes contaminated the water supply with the E. coli bacteria.
While droughts minimize the amount of runoff, they can also cause the water quality to decrease. Sediment and minerals, such as iron and manganese, are more concentrated towards the bottom of the water supply. During a drought, when the level of water decreases, the concentration of sediment and minerals in the water increases.
What Impact Does Temperature Have on Waterborne Illnesses?
A number of studies have found a relationship between temperature and waterborne illnesses. The following chart shows the number of reported cases of diseases that can be waterborne. While some cases were due to contaminated food, this chart illustrates the monthly distribution of the diseases. Cryptosporidiosis, Giardiasis and Legionellosis, in particular, are reported in significantly higher numbers in late summer and early fall, which the Centers for Disease Control and Prevention identify as being a result of the summer recreational water season. For information about any of the following diseases, see Cryptosporidium, E. coli, Giardia, Hepatitis A, Legionella, Vibrio cholerae and Shigella.
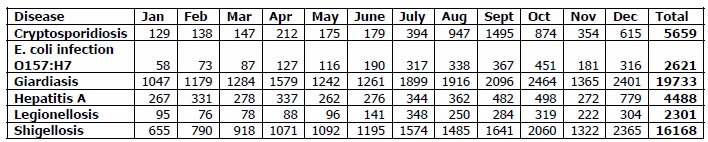
Selected Waterborne Diseases Reported in the United States in 2005 by Month;
https://www.cdc.gov/mmwr/preview/mmwrhtml/mm5453a1.htm
The following charts illustrate the distribution of waterborne illnesses in the United States in 1993 and 1994, by month. The first chart shows the outbreaks associated with drinking water. March, June and August had the highest number of disease outbreaks. While the outbreaks may have multiple causes, such as increased runoff (due to spring melting or increased precipitation), an increase in temperature may have also contributed to the severity of the outbreak.
The second chart shows the outbreaks associated with recreational water, such as lakes and swimming pools. It should be no surprise that July and August were the months with the most diarrheal illness outbreaks (or gastrointestinal illnesses), because more people are exposed to the bacteria, parasites and viruses, and there may be more present during months with warmer temperatures.

Distribution of Waterborne Disease Outbreaks in the United States in 1993-94 by Month;
https://www.cdc.gov/mmwr/preview/mmwrhtml/00040818.htm
In a recent Canadian study, the effect of temperature on the occurrence of Salmonella, E. coli and Campylobacter was studied in Alberta and Newfoundland between 1992 and 2000. In Alberta, the researchers found that, for every degree increase in the average weekly temperature, the number of reported cases of campylobacteriosis increased by 2.2 percent and the number of reported cases of E. coli increased by 6.0 percent. In Newfoundland, they found that, for every degree increase in the average weekly temperature, the number of reported cases of campylobacteriosis increased by 4.5 percent.
During the El Nino phenomenon, an average temperature increase of five degrees Celsius led to a 200 percent increase in diarrhea in children in Peru. A group of researchers, studying these outbreaks, estimated that an increase in the temperature by one degree Celsius causes the number of diarrheal illnesses to increase by eight percent.
The World Health Organization estimates that there are approximately four billion cases of diarrhea each year, and 2.2 million deaths resulting from diarrheal illnesses. This means that, if the average global temperature was to increase by one degree, there could be an additional 320 million cases and 176,000 deaths from diarrheal illnesses!
So What Can I do to Decrease My Chances of Contracting a Waterborne Disease?
Even though waterborne diseases can be caused by bacteria, viruses, and parasites, there are some actions that you can take to reduce your chances of contracting any waterborne disease. The most effective prevention method is practicing good hygiene. For more information about any of the specific waterborne diseases, including prevention measures, see Campylobacter, Cryptosporidium, E. coli, Giardia, Helicobacter pylori, Hepatitis A, Legionella and Shigella.
The Safe Drinking Water Foundation has other educational programs that can be taught with this set of lessons. Operation Water Drop looks at what chemical contaminants there are in water and is designed for a science class. Operation Water Flow looks at how water is used and where it comes from and is designed for a Social studies and Math collaboration. Operation Water Spirit presents a First Nations perspective of water and water issues and is designed for a Native Studies class. Operation Water Health looks at common health issues surrounding drinking water in Canada and around the world and is designed for a Health, Science and Social Studies collaboration. Operation Water Pollution focuses on how water pollution occurs and how it is cleaned up and has been designed for a Science and Social Studies collaboration. To access more information on these and other educational activities visit the Safe Drinking Water Foundation website at www.safewater.org.
Did you know that our Operation Water Health program is used in schools all over the world to teach students about what safe drinking water is, what unsafe drinking water is, and health problems that can be caused by unsafe drinking water? Please help us to keep our Operation Water Health program updated! Please chip in $5 or donate $20 or more and receive an Official Donation Receipt for Income Tax Purposes.
Resources:
Centers for Disease Control and Prevention. 1996. Morbidity and Mortality Weekly Report: Surveillance for Waterborne - Disease Outbreaks -- United States, 1993-1994.
Curriero, Frank C.; Patz, Jonathan A.; Rose, Joan B.; & Lele, Subhash. August 2001. American Journal of Public Health: The Association Between Extreme Precipitation and Waterborne Disease Outbreaks in the United States, 1948-1994.
https://www.ncbi.nlm.nih.gov/pmc/articles/PMC1446745/